Which Jobs Is AI Building a Coffin For?
Which Jobs Is AI Building a Coffin For?
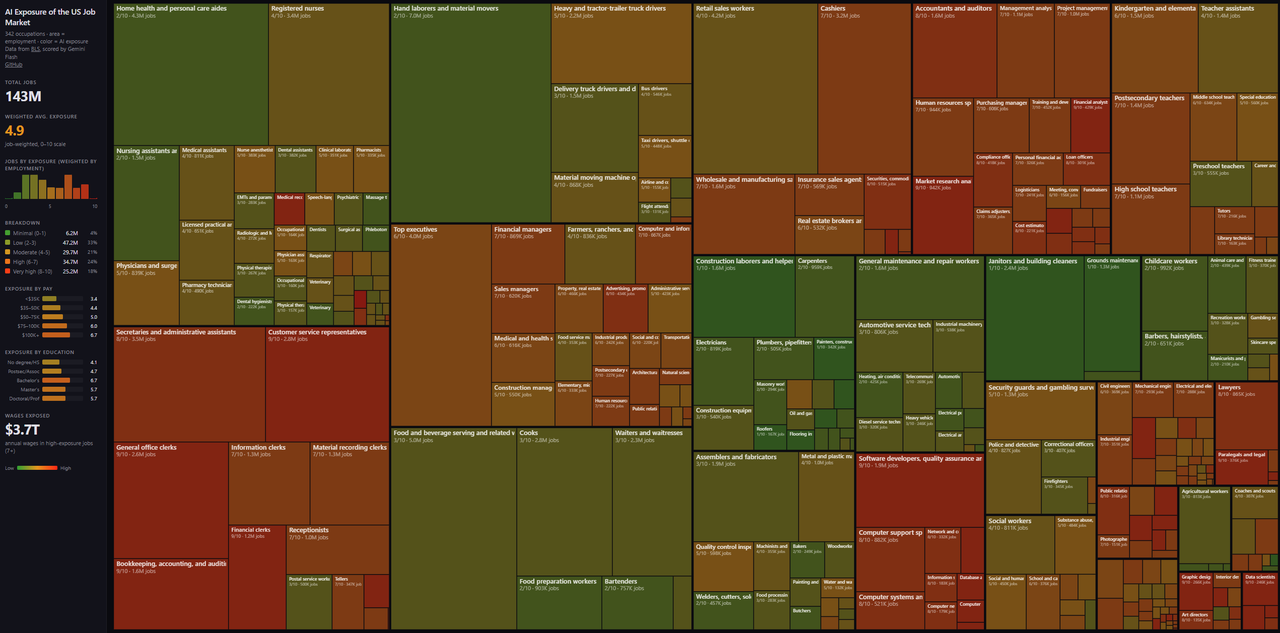
Data source: joshkale.github.io/jobs · Occupations scored: 342 · Avg. AI exposure: 5.3 / 10
The conversation about AI and jobs has been dominated by vibes. Economists argue about whether this time is different. Tech optimists insist new jobs will emerge. Doomers predict mass unemployment. What has been lacking is a granular, occupation-by-occupation reckoning, until now.
A new open-source project, AI Exposure of the US Job Market, does exactly that. It systematically scraped the Bureau of Labor Statistics' Occupational Outlook Handbook, the closest thing America has to an official census of work, covering all 342 defined occupations. Each job description was then scored by an AI model for susceptibility to disruption on a scale from 0 to 10.
The average came back at 5.3 out of 10. By that measure, half the economy is already squarely in the crosshairs.
How the Numbers Were Made
The methodology is fully open-source and reproducible across five steps:
- Scrape. All 342 BLS occupation pages were downloaded using Playwright. The BLS blocks automated bots, so the scraper ran in non-headless mode, a small but telling irony.
- Parse. BeautifulSoup converted raw HTML into clean Markdown descriptions for each occupation, preserving job duties, work environment, education requirements, and pay data.
- Tabulate. Structured fields (median pay, education requirement, job count, projected growth) were extracted into a CSV for statistical analysis.
- Score. Each occupation's Markdown description was sent to Gemini Flash via OpenRouter with a consistent scoring rubric. Every job received a 0-10 AI Exposure score plus a written rationale.
- Visualize. Results were merged into an interactive treemap where area equals employment size and color equals AI exposure, from green (low) to red (high).
"A key signal is whether the job's work product is fundamentally digital. If the job can be done entirely from a home office on a computer, AI exposure is inherently high."
The Full Exposure Spectrum
| Score | Risk Level | Example Occupations |
|---|---|---|
| 10 | Maximum | Medical Transcriptionists |
| 8-9 | Very High | Software Developers, Paralegals, Data Analysts, Editors |
| 6-7 | High | Teachers, Managers, Accountants, Engineers |
| 4-5 | Moderate | Registered Nurses, Retail Workers, Physicians |
| 2-3 | Low | Electricians, Plumbers, Nurses' Aides, Firefighters |
| 0-1 | Minimal | Roofers, Janitors, Construction Laborers |
Medical transcriptionists scoring a perfect 10 is not a surprise. AI voice-to-text has already hollowed out that profession over the past decade. What is striking is the company at the top: software developers, the very people building AI, score 8-9. The irony is not subtle.
Physicians sit in the moderate range (4-5), which surprises many but makes sense on reflection. Diagnosis and research are deeply AI-amenable. But the physical act of medicine, the examination, the bedside manner, the emergency-room judgment call, remains stubbornly analog.
What the Treemap Reveals
The project's interactive treemap visualization scales each occupation's rectangle by employment count, so the visual weight of retail sales workers dwarfs that of actuaries, regardless of their exposure scores.
The effect is sobering. A sea of orange-to-red tiles covers large employment clusters in administrative support, information work, and business operations, suggesting the exposure is not concentrated in niche professions but sprawls across the backbone of the white-collar economy.
The green islands, the safe harbors, cluster around the physical: construction trades, hands-on healthcare support roles, food preparation. These are often the jobs society has historically undervalued. The irony of automation may be that the labor market is finally forced to reprice physical skill.
Caveats Worth Keeping in Mind
| Limitation | Why it matters |
|---|---|
| Susceptibility vs. inevitability | A score of 8 means the work is AI-amenable, not that the job disappears. It could mean fewer people doing more, or the same people doing different work. |
| LLM as judge | Gemini Flash applies a consistent rubric, but BLS descriptions are written by economists, not frontline workers, and may miss day-to-day granularity. |
| Rapid model evolution | A score set in 2025-2026 may shift significantly as multimodal capabilities improve. Some 6s could become 9s within eighteen months. |
Why This Project Matters
"AI will disrupt jobs" is a slogan. A treemap showing that your specific profession sits at 7.2, sandwiched between accountants and financial analysts, is information you can actually act on.
The full pipeline, scraping scripts, scoring prompts, raw BLS data, and the complete dataset, is available on GitHub. Anyone can audit the rubric, run alternative models, or extend the analysis. That kind of reproducibility is rare in the breathless discourse around AI and labor.
Whether the average exposure of 5.3 turns out to be an overestimate or a harbinger depends on decisions that haven't been made yet: by companies, by policymakers, by workers themselves. The data doesn't decide. It illuminates.
Source: joshkale.github.io/jobs · Data: BLS Occupational Outlook Handbook · Scoring pipeline: github.com/karpathy/jobs